
I’m an analyst/ researcher at heart – therefore my respect for and interest in statistics is almost par for the course. (I like to remember what George Bernard Shaw once said “It is the mark of a truly intelligent person to be moved by statistics.”)
I also ofcourse completely subscribe to Homer Simpson’s view that “Oh, people can come up with statistics to prove anything, Kent. 14% of people know that.” 🙂 ; or, “There are liars, damn liars and statistics”
Having said that, some of the analysis I see nowadays is just…well…plain…bizarre. Some recent examples of analyses that i came across in the past few days, and, IMHO, helps very few people (this is a bit like the bear of little brain) are listed below. Even though many of the se are pointless, you have to admit most do arouse curiosity, and are fun!:

a) On the Great Selfie Revolution – Ofcourse, the stats on this have probably been turned on their head post last night’s “most retweeted ever” selfie by Ellen Degeneres. But, someone did an analysis of what how selfies differ by countries and what they portray about the selfie takers (what are they called? selfers?). Click for Selfie Trends .
b) A similar one, on Love – as seen by Facebook. Excerpt from this analysis – For example, two people who are about to enter a relationship interact more and more on Facebook in the weeks leading up to making their coupled status official – up until 12 days before the start of the relationship, when they share an average of 1.67 posts per day. And this helps us….how?
c) A map of the world showing the places in blue where there are no Mcdonalds! Wonder where 3 year olds have (cheap-ish) birthday parties?

Credit
d) It is not only surveys that show bizarre analysis – a look at some “weird facts” will convince you that some people have all the time in the world!
di) On average, there are 333 squares of toilet paper on a roll.
dii) The short-term memory capacity for most people is between five and nine items or digits. This is one reason that phone numbers were kept to seven digits for so long.
diii) The hundred billionth crayon made by Crayola was Periwinkle Blue.
div) In Saudi Arabia, a woman reportedly may divorce her husband if he does not keep her supplied with coffee.
dv) 1 out of 350,000 Americans get electrocuted in their life.
e) Ok, this one should interest a lot of folks – just wondering at the “usability” of this piece of research (beyond performance anxiety of course!) So, on Fast Sex !
f) And, perhaps, fittingly, as a sequel (but atleast this I can see being used by the Spirits companies) : Places with Highest vodka consumption.
g) Since we touched upon love, can families be far behind? This is a list of Kickstarter Funding stats. (And, just in case you were wondering, it is topical because Kickstarter just announced that they have reached a billion dollars in funding). An excerpt says : there have been 13 backers named dad, five named grandpa, 17 named grandma and 18 named Mom. “Clearly, moms are the best,” the post adds. Wish my kids would read this – atleast they would know that while moms are evil, they fund your harebrained (or not) schemes more than anyone else!
h) More factoids:
hi) 27% of female lottery winners hid their winning ticket in their bras.
hii) 96% of people put the peanut butter on first when making a peanut butter and jelly sandwich.
hiii) A study revealed that men that were born with a low birth weight were less likely to get married.
hiv) Your statistical chance of being murdered is one in twenty thousand.
hv) Two out of three people sleep on their sides, and they’re about equally divided as to WHICH side. Of the remainder, slightly more sleep on their stomachs than sleep
i) More maps: To show the insularity of the erstwhile British Raj, a map showing in red places in the world that drive on the Right Side of the Road

j) And, another to show the insularity of Americans :), one that shows in red the places that don’t use the metric system

k) An analysis that shows the most popular baby names in every state in the U.S. Again, don’t know why people would want to know (unless it was to figure out which name to avoid), but wish someone would do a similar analysis in India – just for fun!
l) I get a kick out of this – even though it’s very random! This map shows the world if all countries with shorelines were to sink, and only the landlocked ones to remain.

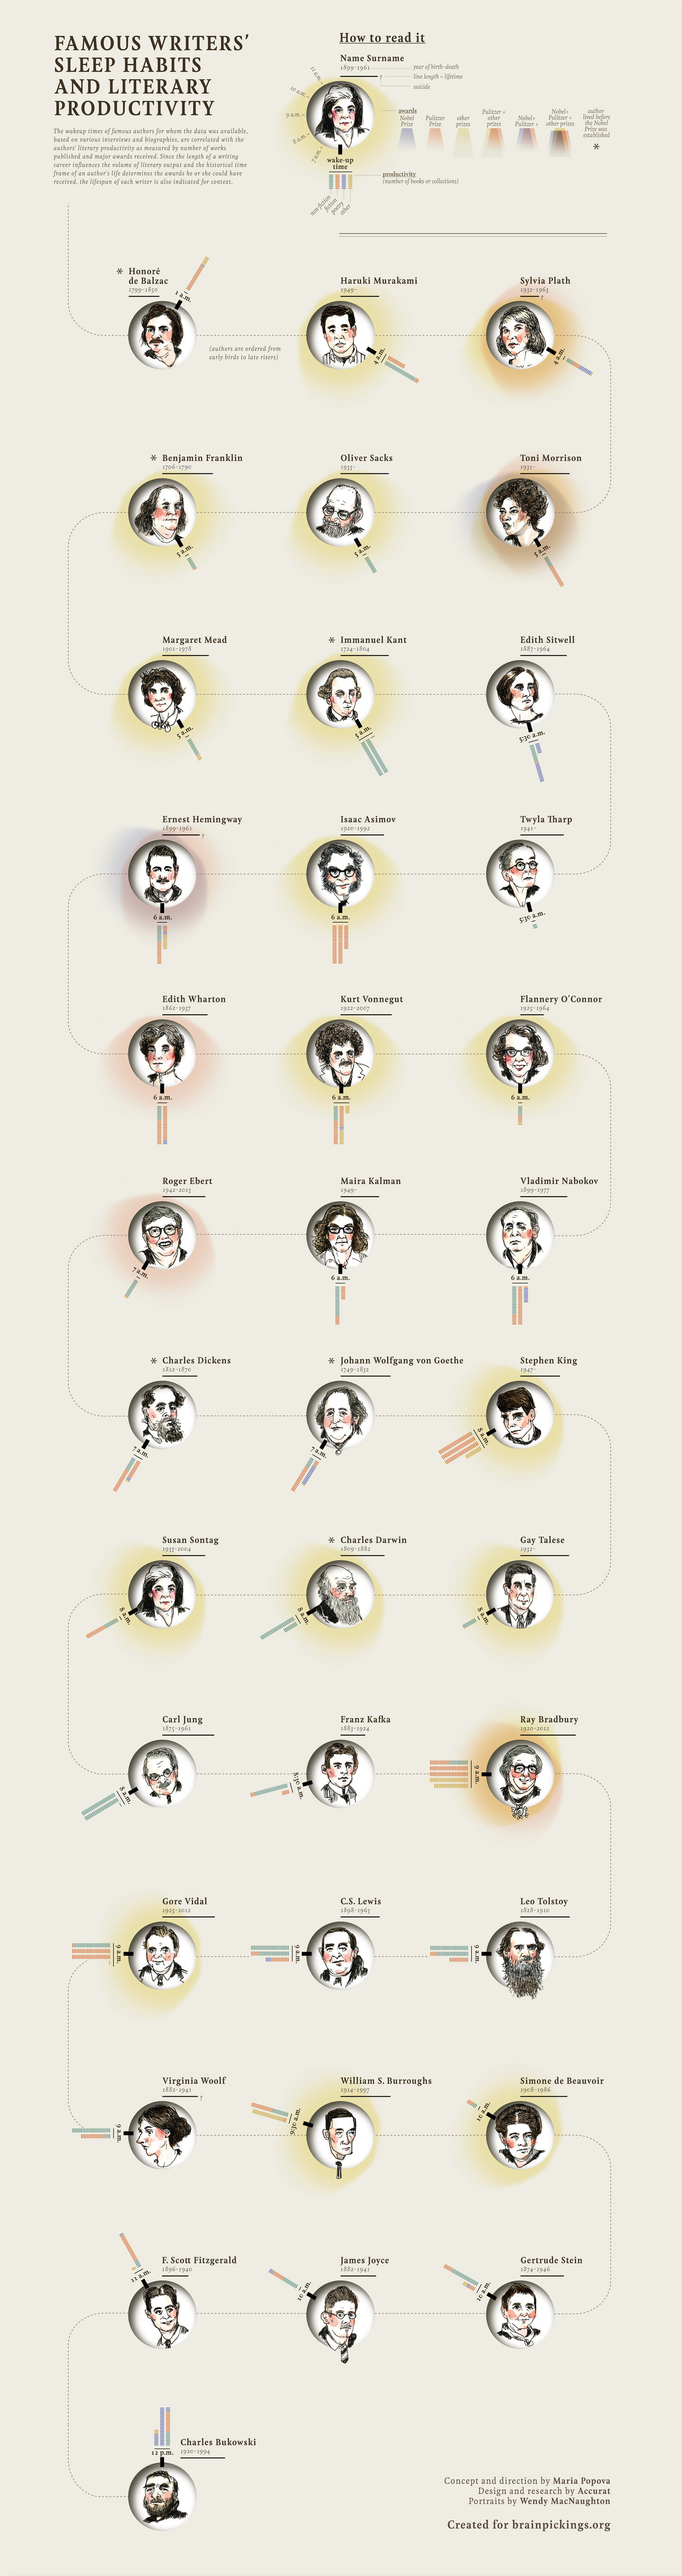
m) For writers/ wannabe authors, who are NOT early birds hoping to get early worms, here’s a beautifully non conclusive piece of analysis on sleep patterns vs. creative outputs. As the result vaguely states, “The most important caveat of all, of course, is that there are countless factors that shape a writer’s creative output, of which sleep is only one — so this isn’t meant to indicate any direction of causation, only to highlight some interesting correlations: for instance, the fact that (with the exception of outliers who are both highly prolific and award-winning, such as like Bradbury and King) late risers seem to produce more works but win fewer awards than early birds”.
n) More weird facts
ni) “Ancient Egyptians shaved off their eyebrows to mourn the deaths of their cats” OK, we love our pets!
nii) “The bubbles in Guinness Beer sink to the bottom rather than float to the top like all other beers. No one knows why” Next time you get your pint, do NOT drown it in one big gulp – please watch the movement of the bubbles!
A related one (just in case you are not into beer, but bubblies) : If you put a raisin in a glass of champagne, it will keep floating to the top and sinking to the bottom.
niii) Jupiter’s core is in fact made of a non-metal, but due to the immense pressure inside Jupiter the core has become a metal. This metal is hydrogen.
niv) A fullgrown bear can run as fast as a horse.
nv) A hamlet is a village without a church and a town is not a city until it has a cathedral.
o) A map showing the world’s most photographed places. Start your bucket list NOW!

p) More random facts:
pi) A lion’s roar can be heard from five miles away.
pii) The reason firehouses have circular stairways is from the days of yore when the engines were pulled by horses. The horses were stabled on the ground floor and figured out how to walk up straight staircases.
piii) A duck’s quack doesn’t echo, and no one knows why.
piv) The ashes of the average cremated person weigh nine pounds.
pv) The fingerprints of koala bears are virtually indistinguishable from those of humans, so much so that they could be confused at a crime scene.
q) A map showing where the highest number of sky scrapers are found
 Credit
A few not so happy pieces of analyses and, you will not, sadly, that India plays a large part here):
r) Now this is atleast worth tracking, though the data quality seems poor. The good part – there is a rise in people reporting, the sad part – the actual number of incidences are not known 😦
s) On Underweight kids 😦
t) And, maybe, related, a map of the world showing population distribution – More People Live inside the circle than outside it! Credit
u) More bizarre facts:
ui) Ralph Lauren’s original name was Ralph Lifshitz.
uii) Isaac Asimov is the only author to have a book in every Dewey-decimal category.
uiii) Approximately sixty circus performers have been shot from cannons. At last report, thirty-one of these have been killed.
uiv) The Boeing 767 aircraft is a collection of 3.1 million parts from 800 different suppliers around the world: fuselage parts from Japan, center wing section from Southern California, flaps from Italy.
uv) In the kingdom of Bhutan, all citizens officially become a year older on New Year’s Day.
By the way, even the Economist does these does these strange analyses – they do it well of course
You may have noticed, none of the above is about sports – but, when I googled “useless stats analysis” – most are about sports, including this website that says as its header: Written by sports fans with minds analytical enough to try wacky stuff but not analytical enough to make money doing it.
v) Facts on supernatural stuff:
vi) Paranormal experts say people reach the peak of their ability to see ghosts when they’re 7 years old.
vii) Someone on Earth reports seeing a UFO every three minutes. In the U.S., reported sightings are most likely to occur in July, at 9 p.m. or 3 a.m.
viii) Someone within 200 miles of your town claims to have had direct contact with a monster, ghost or other unexplainable being.
And some others…
viv) In 1950, only 7% of Americans dyed their hair, now 75% do.
vv) You blink 10,000,000 times every year.
vvi)46% of violence on T.V. occurs in cartoons.
vvii) Only about 5% of people dream in color.
vviii) If a girl owns one barbie, she most likely owns seven.
vix) Your left hand does an average of 56% of your typing.
vx) It takes an average person seven minutes to fall asleep on an average night.
( Credit. If you want more, click here, and here)
And finally, a) something that just came up – it’s interesting stuff…Note, Mumbai tops list of 10 least expensive cities!
and b) a piece of analysis that the cricket crazed Indians are looking at over and over again since yesterday! 😦

